
The Double Top is one of the most recognisable reversal patterns in Forex trading—and for good reason.
When it forms correctly, it can signal that buyers are losing momentum and sellers are beginning to take control.
Unfortunately, it’s also one of the most misunderstood patterns.
Many beginners think any two peaks on a chart qualify as a Double Top. They don’t.
In this guide, I’ll explain what a Double Top is, how I identify high-quality setups, and how I trade them using a simple mechanical approach.
What Is a Double Top?
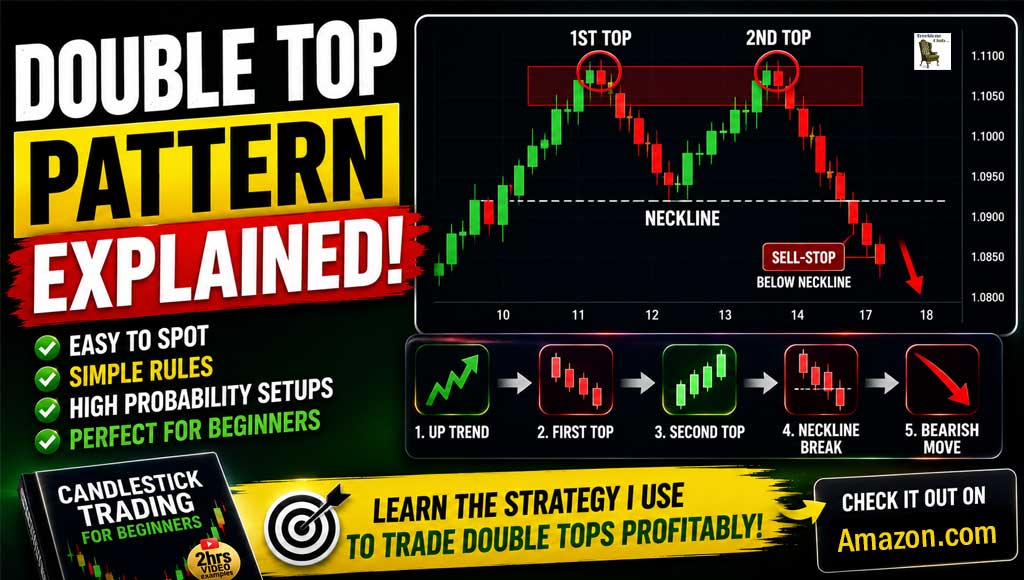
A Double Top is a bearish reversal pattern that forms after a sustained upward move.
Instead of continuing higher, price reaches a level it struggles to break twice.
Between those two highs, price pulls back to create what traders call the neckline.
If price later breaks below that neckline, the pattern is considered complete and a potential bearish move begins.
At its simplest, the pattern looks like this:
📈 Uptrend
⬆ First Peak
⬇ Pullback
⬆ Second Peak
⬇ Neckline Break
⬇ Potential Downtrend
The important point is this:
A Double Top isn’t just two highs.
It’s evidence that buyers are running out of strength.
Why Double Tops Work
Markets move because buyers and sellers constantly compete for control.
During an uptrend, buyers continue making higher highs.
Eventually they push price into an area where sellers begin stepping in.
The first rejection creates the first peak.
Buyers try again.
If they can’t push price significantly higher, confidence begins to fade.
Once price falls below the neckline, many buyers exit their trades while new sellers enter the market.
That shift in sentiment is what often fuels the move lower.
The Four Parts of Every Double Top
1. A Strong Uptrend
The pattern should appear after a clear move higher.
Without an existing uptrend, there is nothing to reverse.
2. The First Peak
Price reaches resistance and begins to fall.
This creates the first top.
3. The Second Peak
Price rallies again but struggles to move above the previous high.
This forms the second top.
The closer the two highs are, the cleaner the pattern usually looks.
4. The Neckline
The lowest point between the two highs is called the neckline.
This is one of the most important levels on the chart.
The pattern is only confirmed once price breaks below it.
How I Trade Double Tops
Over the years I’ve found that simple rules beat complicated ones.
Rather than trying to predict the market, I wait for it to prove the pattern is valid.
My process looks like this.
Step 1
Wait for a clear upward move.
Step 2
Mark the last strong bullish candle at the top of the move.
This becomes my reference box.
Step 3
Allow price to fall away from the box.
Step 4
Wait for price to return into the box.
For me, price must move at least halfway back into the box before I consider the setup valid.
Step 5
Mark the neckline.
Step 6
Place a sell-stop order below the neckline.
If price never breaks the neckline, I never enter the trade.
No chasing.
No guessing.
Just waiting.
Where I Place My Stop-Loss
For my strategy, the stop-loss always goes above the top of the box.
It isn’t moved because of emotion.
It’s placed according to the rules before the trade begins.
Where I Take Profit
My target is mechanical too.
I measure the distance between the top of the box and the neckline.
That same distance is projected below the neckline to create my take-profit.
This gives me a fixed 1:1 risk-to-reward ratio and removes the temptation to constantly adjust trades.
Common Double Top Mistakes
Entering Before the Neckline Break
Many beginners sell too early.
Until the neckline breaks, the pattern is only a possibility.
Ignoring the Trend
A Double Top should appear after a meaningful move higher.
Without an uptrend, the pattern loses much of its significance.
Trading During Major News
Economic news can destroy an otherwise perfect setup.
I avoid placing or holding trades around high-impact news releases.
Moving the Stop-Loss
Changing your stop because you “hope” price comes back usually makes a small loss much bigger.
Stick to the plan.
Seeing Double Tops Everywhere
Not every pair of peaks is tradable.
Patience is one of the most valuable skills a trader can develop.
Why I Prefer the 1-Hour Chart
Although Double Tops appear on every timeframe, I find the 1-hour chart offers the best balance.
It filters out much of the noise found on lower timeframes while producing regular, well-structured setups.
It also gives me time to analyse the chart, place pending orders and walk away without feeling glued to the screen.
Want to Learn the Complete Strategy?
Everything in this article explains what a Double Top is.
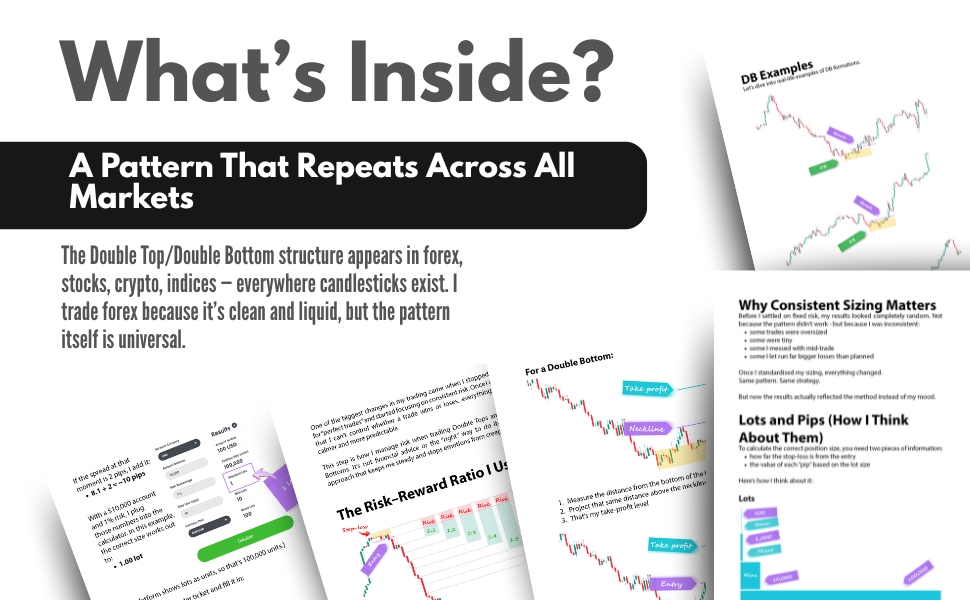
In Candlestick Trading for Beginners, I go much further and show the complete trading process I use every day.
Inside the book you’ll learn:
✔ How I define a valid Double Top
✔ The box method I use to qualify setups
✔ Entry rules using pending orders
✔ Stop-loss and take-profit placement
✔ Risk management using fixed 1% risk
✔ Why I trade the 1-hour and 15-minute charts
✔ The daily routine that keeps my trading calm, mechanical and repeatable
If you’re looking for a straightforward, rule-based approach without complicated indicators, it’s the natural next step after this guide.

Check it out on Amazon.com
Check it out on Amazon.com
Final Thoughts
The Double Top is a simple pattern—but trading it consistently requires patience and discipline.
Rather than trying to predict every market move, wait for the structure to develop, let price confirm the setup, and follow a written plan.
One good trade won’t make you a successful trader.
Hundreds of well-executed trades, managed with consistent rules, will.
Master the process, protect your capital, and let the probabilities work in your favour.