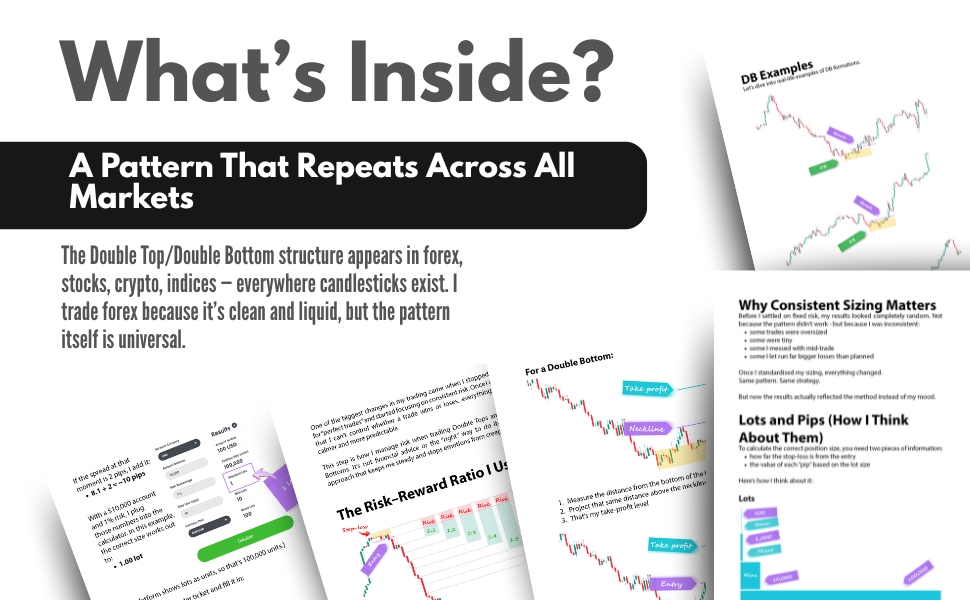
Here, you’ll find a breakdown of how the GBPUSD performed over a 12-month period using the strategy outlined in the book. This page is designed to give you a practical understanding of applying the strategy to real market conditions.
Monthly Winners and Losers Chart
The chart lists all the winning and losing trades for the GBPUSD over 12 months. All trades were taken between 05:00 and 22:00 (London GMT).
P/Gain is any gain less than a full gain, and likewise with P/Loss. A Flat trade is a trade in which we get out where we got in, give or take.
Trading Video
The video showcases the strategy’s performance against the GBPUSD over a 12-month period. Each trade on the chart is marked with symbols explained in the legend below.
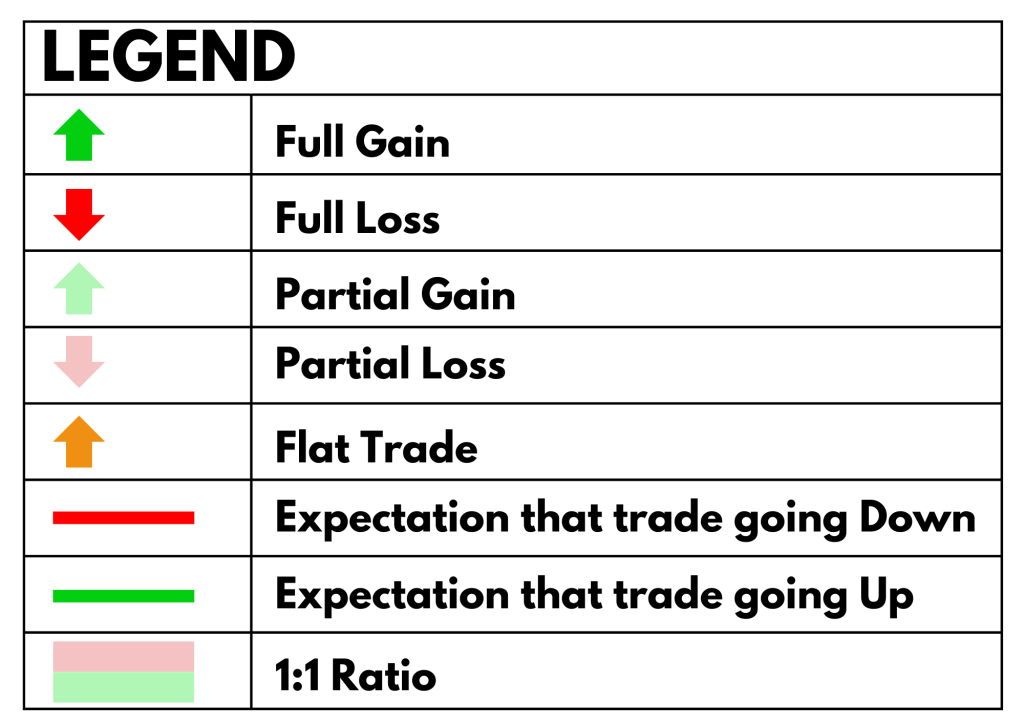
As you watch the video, these symbols will appear to help illustrate how the trades played out.
This visual representation helps solidify your understanding of the strategy and its application.
Check it out on Amazon.com
Check it out on Amazon.com